By default, when your program that is compiled with ThreadMentor starts, it automatically brings up ThreadMentor's visualization subsystem. Click here for an overview. Once the visualization system starts, it first displays the following information window. Click on OK to continue.
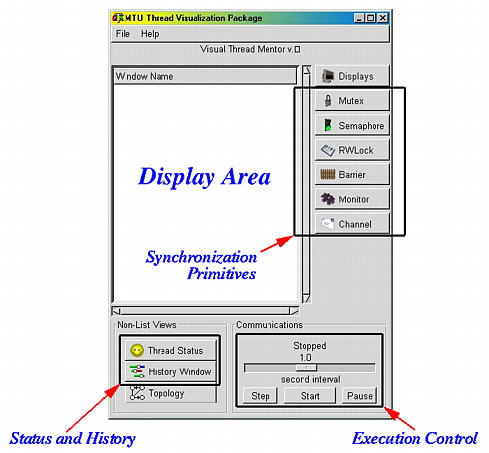
In fact, on your screen, you should also see the following main window. This main window has a few important elements. First, the big white area is the Display Area that displays what windows are active and their pertinent information. Second, there are seven button in the right end of the window. The last six buttons permit us to select one of the six synchronization primitives to be displayed in the display area. Third, the lower-right corner has a slide and three buttons that help us control the execution of the threaded program. Fourth, the top two buttons in the lower-left corner display the thread status and history. For now, only the third and fourth groups are important to us.
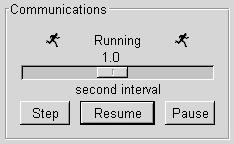
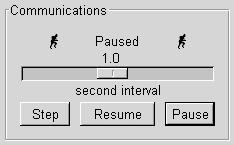
When the visualization starts, it immediately blocks the execution of your program so that you can determine what to do next. You may click on the Start button to start the execution. Then, you should see a pair of running icons and the Start button changes to Resume. See the left image below. Why Resume? It is because you can click on the Pause button to pause the execution of the running program. Once you click on the Pause button, the two running icons stop running and Pause appears. This is useful because you can examine what has happened in your program. More on this later. To continue, click on the Resume button.
|
|
| System is running | System is paused |
The visualization system can control the execution speed. Move the slider to the right to increase the execution speed (i.e., running the program in a faster pace), and move the slider to the left to slow down the execution.
Use the Step button to step through the execution of synchronization primitives. We shall return to this when we discuss synchronization primitives.
Click on the Thread Status button to bring up the Thread Status window as shown below. This window displays the status of each thread on-the-fly. To the left of the window is a list of names of the created threads. The main thread always has the name Main. Other threads have the names set by the constructor; otherwise, the thread name field will display Noname. Thus, giving a name to each thread helps you easily visualize the behavior of the threads. In the window, we have six threads with names Main, Philosopher0, Philosopher1, ..., Philosopher4.
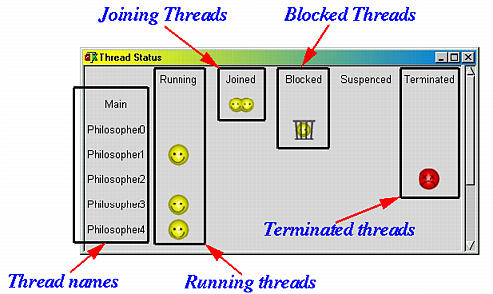
The top part of the window has Running, Joined, Blocked, Suspended and Terminated, indicating the status of a running, joining, blocked, suspended, and terminated thread. Each status has its own icon. In the window, we see that threads Philosopher1, Philosopher3 and Philosopher4 are running, the Main thread is joining (i.e., waiting for its child threads to complete), thread Philosopher0 is blocked by a synchronization primitive, and thread Philosopher2 has terminated. There is no suspended thread.
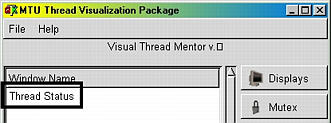
Note that the display area of the main window will show Thread Status to indicate that the Thread Status window is currently active:
As the status of a thread changes, it is reflected in the Thread Status window on-the-fly. As a result, you will be able to learn the status of all threads created so far at any moment.
Click on the History Window button to bring up the History Graph window, or simply the History window as shown below. In fact, some may prefer to call it a space-time window.
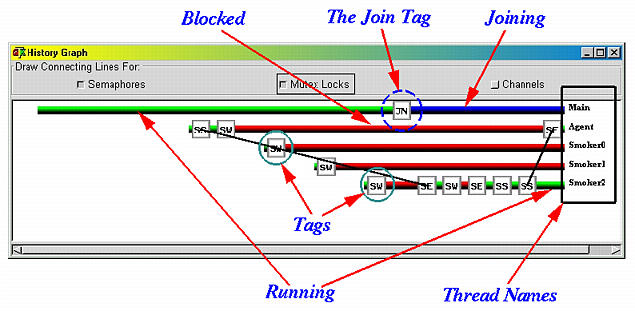
Each thread created so far is associated with a horizontal bar, the history bar of the thread, extending from right to left, with the thread name in the right end of each bar. The above window shows that there are five threads, namely: Main, Agent, Smoker0, Smoker1 and Smoker2. Each history bar may have sections with different colors. Colors green, read and blue mean the corresponding thread is running, blocked and joining in that section. Since the main program always starts before its child threads, its history bar starts with color green, meaning it is running. Then, the main program creates child threads, some of them may start to run and some other may be blocked immediately. In the above, thread Agent runs for a short amount of time and blocks. Similarly, thread Smoker2 blocks for a long time and finally runs. After all four child threads are created, the main program waits for their completion, and, as a result, the last section of its history bar turns to blue.
On each history bar, there may be some tags (i.e., small squares with a two-letter annotation). These tags mark the important events that have occurred to a thread. For example, the tag JN means the thread is suspended and waiting for a join. See the history bar of the main thread for such a join tag.
When the program runs, these bars scroll to the left so that the thread names always appear in the right border. If there are more threads, the history bars of the newly created threads may be hidden. One can either resize the window, or use the horizontal and vertical scroll slides to see the other parts of the graph.
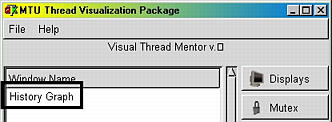
Note that the display area of the main window will show History Graph to indicate that the History Graph window is currently active:
If both the Thread Status and History Graph windows are active, then Thread Status and History Graph will both be shown in the display area of the main window.
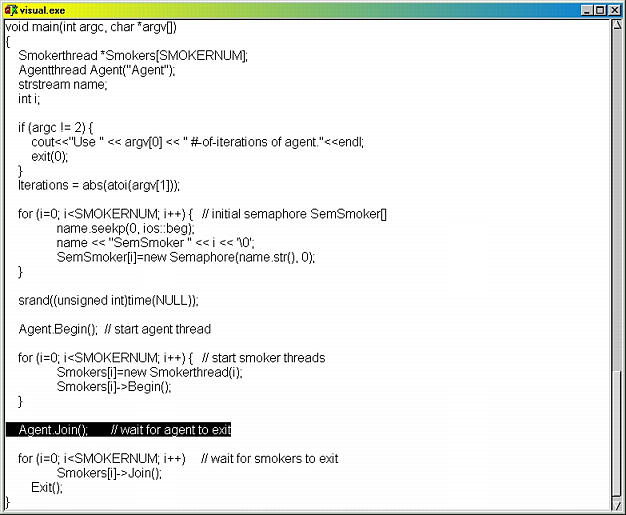
Since tags indicate important events, ThreadMentor allows you to see the statement that causes a particular event to occur. To do so, you have to bring up the History Graph window and click on the tag that corresponds to the event you wish to know. A new window appears in which the statement that corresponds to the selected event is highlighted.
Let us return to the History Graph window shown earlier. Click on the tag JN to bring up a source window as show below. As you can see, the main program is waiting for thread Agent to complete by executing statement Agent.Join().
Ok, some of you may want to ask a few questions. Before you ask, here are my answers.
