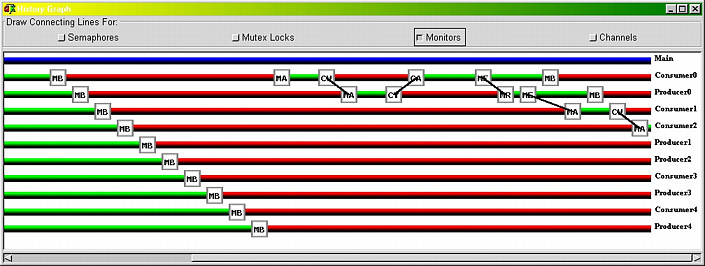
Suppose we run this program with five producers and five consumers, and the buffer size is 3. After all ten threads are created, they try to enter the monitor. The first one that successfully enters the monitor is Consumer0. Since the buffer is empty, Consumer0 is blocked (i.e., the CW tag). Since this is a Hoare monitor, thread Consumer0 yields the monitor to another thread, which, in this case, is Producer0. Since the buffer is empty, Producer0 adds its data into the buffer and signals the consumers to indicate that the buffer is not empty. Then, Producer0 yields the monitor (i.e., the CY tag). This causes Consumer0 to become active (i.e., the CA tag). Thus, Consumer0 retrieves the only data and exits the monitor. Note that since all producers, except for Producer0 which is inactive, are waiting to enter the monitor, the signal that is sent by Consumer0 to indicate that the buffer is not full is lost. When Consumer0 exits, Producer0 becomes active and resumes its execution (i.e., the MR tag). Then, Producer0 exits, and Consumer1 enters. Since the buffer is empty, it blocks. This makes Consumer2 to enter the monitor.
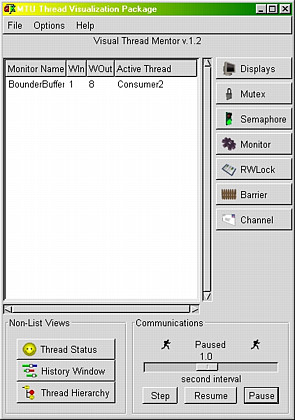
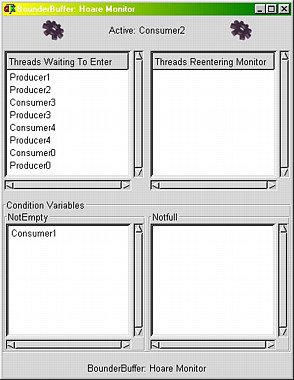
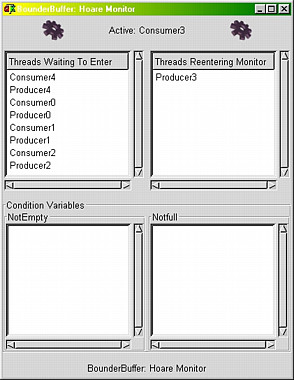
The following main window and Monitor window justify the above observation. The main window shows that the current active thread is Consumer2. There is only one thread in the monitor (i.e., Consumer1). In fact, from the Monitor window and the above History Graph windows, thread Consumer1 is blocked by condition variable NotEmpty, because the buffer is empty. All the other eight threads are waiting to enter the monitor.
|
|
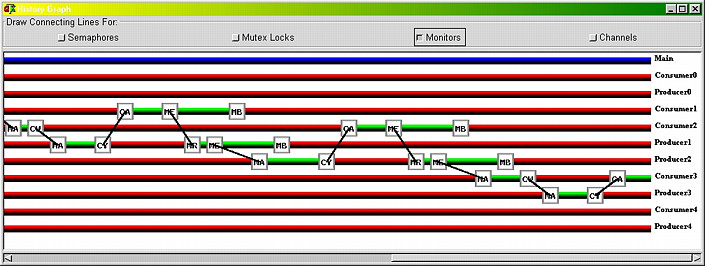
The following History Graph is a continuation of the previous one. Right after Consumer2 enters the monitor, it is blocked on condition variable NotEmpty because the buffer is empty. The control is yielded to the next thread Producer1. Because the buffer is empty, Producer1 adds its data to the buffer, signals condition variable NotEmpty, and yields the monitor. This signal releases Consumer1, which retrieves a data item and exits the monitor. The remaining activities are very similar and will not be further discussed.
It is not difficult for you to complete the interpretation of the History Graph window and match the events with the results shown in the main window and the Monitor window.

|
|

|
|
|
|