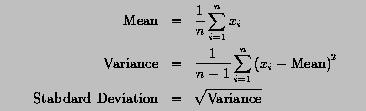
Write a program to read in a set of real values and use the above formulas to compute the mean, variance and standard deviation. Moreover, this program should generate a table containing the following addition information:
! --------------------------------------------------------------------
! PROGRAM  MeanVariance:
!    This program reads in an array and computes the mean, variance
! and standard deviation of the data stored in the array.  Then, it
! displays an analysis table.  If a value is greater than the value
! of (mean + standard deviation), it displays a "good".  If a value
! is less than the value of (mean - standard deviation), it displays
! a "bad".
! --------------------------------------------------------------------

PROGRAM  MeanVariance
   IMPLICIT  NONE

   INTEGER, PARAMETER :: MAX_SIZE = 50       ! maximum array size
   REAL, DIMENSION(1:MAX_SIZE) :: Data       ! input array
   REAL               :: Mean, Variance, StdDev   ! results
   INTEGER            :: n                   ! actual array size
   INTEGER            :: i                   ! running index

   READ(*,*)  n                         ! read in input array
   READ(*,*)  (Data(i), i = 1, n)
   WRITE(*,*)  "Input Data:"            ! display the input
   WRITE(*,*)  (Data(i), i = 1, n)

   Mean = 0.0                           ! compute mean
   DO i = 1, n
      Mean = Mean + Data(i)
   END DO
   Mean = Mean / n

   Variance = 0.0                       ! compute variance
   DO i = 1, n
      Variance = Variance + (Data(i) - Mean)**2
   END DO
   Variance = Variance / (n - 1)
   StdDev   = SQRT(Variance)            ! compute standard deviation

   WRITE(*,*)                           ! display result
   WRITE(*,*)  "Mean               : ", Mean
   WRITE(*,*)  "Variance           : ", Variance
   WRITE(*,*)  "Standard Deviation : ", StdDev
   WRITE(*,*)
   WRITE(*,*)  "Analysis Table:"        ! display an analysis table
   DO i = 1, n
      IF (Data(i) > Mean + StdDev) THEN
         WRITE(*,*)  Data(i), Data(i) - Mean, "<-- Good"
      ELSE IF (Data(i) < Mean - StdDev) THEN
         WRITE(*,*)  Data(i), Data(i) - Mean, "<-- Bad"
      ELSE
         WRITE(*,*)  Data(i), Data(i) - Mean
      END IF
   END DO

END PROGRAM  MeanVariance
Click here to download this program.
The out of the program is:10 6.6 6.0 4.0 9.0 4.5 7.3 9.5 8.0 7.0 5.2
Input Data:
6.5999999,  6.,  4.,  9.,  4.5,  7.30000019,  9.5,  8.,  7.,  5.19999981

Mean               : 6.71000004
Variance           : 3.3498888
Standard Deviation : 1.83027017

Analysis Table:
6.5999999,  -0.110000134
6.,  -0.710000038
4.,  -2.71000004<-- Bad
9.,  2.28999996<-- Good
4.5,  -2.21000004<-- Bad
7.30000019,  0.590000153
9.5,  2.78999996<-- Good
8.,  1.28999996
7.,  0.289999962
5.19999981,  -1.51000023