The report Huron Creek Watershed 2005 Land Use Map documents the percentages of land that is devoted to different types of land use. The following is a summary of the data in that report.
| Land Use Map |
| Profile of Current Land Use |
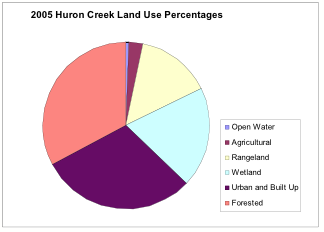
The following pie chart shows the percentage of land currently (2005) devoted to particular types of uses:
| Change in Land Use Over Time |
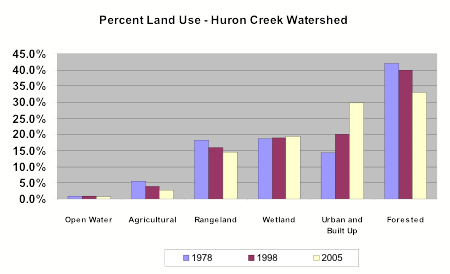
The following table shows the percentage of different land uses in the watershed for 1978, 1998, and 2005. Land use data was acquired by comparing these percentages with those derived from the land use map based on the 1998 digital orthophoto (prepared by Hans Bruning, Feb. 2006) and the 1978 MIRIS land use dataset.
|
|
Land Use Percentage |
||
| Land Use Type |
1978
|
1998
|
2005
|
| Open Water |
1.00% * |
1.00% |
0.60% |
| Agricultural |
5.60% |
4.00% |
2.80% |
| Rangeland |
18.20% |
16.00% |
14.50% |
| Wetland |
18.80% |
19.00% |
19.40% |
| Urban and Built Up |
14.40% |
20.00% |
29.80% |
| Forested |
42.00% |
40.00% |
32.90% |
* Open water data was not available for 1978 and so it was assumed the percentage land use was the same as 1998. The one percent in the “open water” category was subtracted from the “forested” category.
Below, the same data (change in land use over time) is shown as a bargraph: