GE304/CE304
Test #2
5/3/95
Name __________________________________


  1. Discuss the factors that control the resistivity of earth materials and their effect? (4 pts)
  2.  

  3. The Earth's gravitational field varies as a function of latitude. What are the different components of this variation and how does each affect the gravity field of the Earth. (6 pts)
  4.  

  5. A gravity survey requires locating a gravity station at a site on a mountain top and a site on the floor of a valley. Simple Bouguer anomalies are calculated at both sites. Which of the following statements would be true: (a) one value too high the other too low; (b) values at both sites would be too high; (c) values at both sites would be too low. Explain! (3 pts)
  6.  

  7. Plot the following resistivity data and determine the resistivity of layers 1 and 2 and the thickness of layer 1. Master curves and tracing paper will be provided. Be sure to put your name on the tracing paper and try not to write on the Master curve. (4 pts)
  8.  

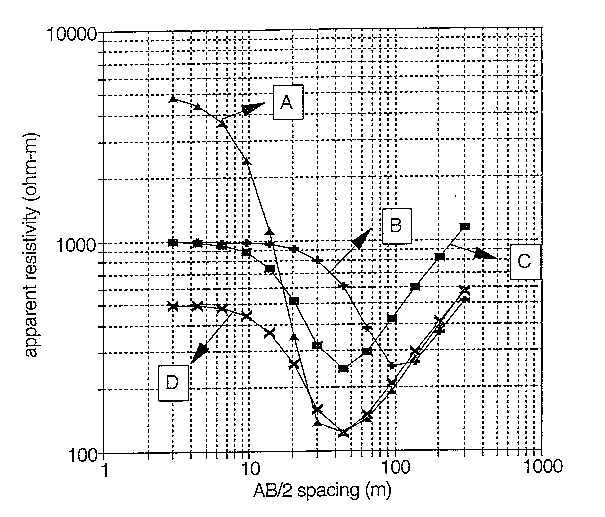
    "a" spacing (meters)

    apparent resistivity (ohm-meters)

    5

    210

    10

    276

    15

    360

    20

    450

    30

    610

    50

    850

    100

    1210


  9. The simple Bouguer gravity anomaly from Homework #7 is shown below. Draw in the regional. Is the residual anomaly caused by a positive or negative density contrast? _________________________ (3 pts)

  10. 6. The questions below refer to the resistivity sounding curves (A, B, C, D) shown on the graph above. (5 pts)
    1. Which sounding curve has the thickest first layer? ____
    2. Which sounding curve has the thickest second layer? ____
    3. What is the resistivity of the first layer for curve B? ____
    4. For which two curves are the ratios of 2/1 and 3/1 the same? _______
    5. Which curve has the thinnest first layer? ____


  11. Computer modeling indicates that layer 2 for sounding curve B above has a resistivity of 100 ohm-m and a thickness of 50 m. Seismic data indicate that layer 2 is 25 meters thick. If the seismic interpretation is correct, why the difference? (2 pts)
  12.  

  13. Illustrate using a sketch, the geometric configuration of the electrodes for the resistivity arrays given below. Be sure to label current and potential electrodes, distances between electrodes, and any restrictions concerning the array. (6 pts)
    1. Schlumberger
    2.  

    3. Wenner
    4.  

    5. Dipole-dipole


  14. Which figure below illustrates how current flows across a boundary separating a high resistivity surface layer from a low resistivity lower layer? ______. (1 pt) Which figure illustrates convergence? ____ (1 pt)
  15.  

  16. 10 Gravity reduction problem (12 pts)
  17. Station

    Time

    Readings (du)

    Elevation (m)

    Distance

    BS

    8:00

    1515.5


    1

    8:30

    1432.9

    234.5

    0

    BS

    9:30

    1524.5


    2

    10:30

    1479.0

    250.9

    150

    BS

    11:00

    1506.5


    3

    11:45

    1489.2

    265.7

    300

    BS

    12:30

    1515.5


    Gravimeter dial constant = 0.9745 gu/du
    Bouguer reduction density = 2.45 Mg/m3
    Observed gravity at base BS = 9,805,003.2 gu
    Latitude of base = 47.4 oN
    gth at base = 9,808,360.6 gu
    Elevation of the base = 200 m
    Station 1 is located 500 meter West and 200 m South of the base station

    Survey line runs N/S with Station 1 on the northern most station

    1. What is the drift correction for Station 1?
    2.  

    3. What is the drift correction for station 3?
    4.  

    5. What is the difference in gravity between stations 1 and 3 due to latitude only and which station would have the higher value due to this effect?
    6.  

    7. What is the difference in gravity between stations 1 and 3 due to elevation only and which station would have the higher value due to this effect?
    8.  

    9. What is the simple Bouguer anomaly at station 1 if the reference level is mean sea level?
    10.  

    11. What is the simple Bouguer anomaly at the base station if the reference or datum plane is 200 m instead of mean sea level?


  18. 11. Which statements given below are associated with the Wenner array and which with the Schlumberger array? Put a W in the blank if the statement holds for the Wenner configuration and an S if it holds for the Schlumberger configuration. (2 pts)
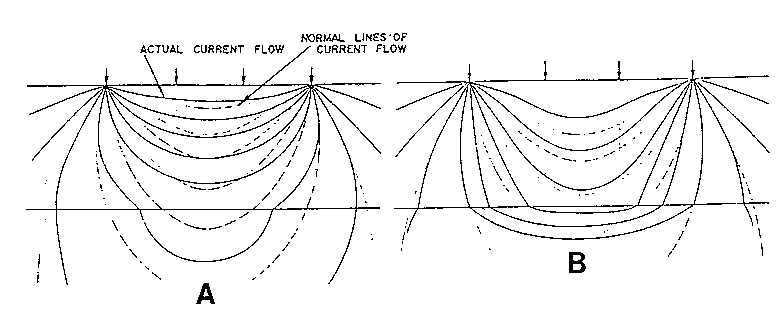
  19. _____lateral variations are more easily recognized in the sounding data

    _____potential electrodes are moved after each sounding measurement

    _____sounding curves portray a slightly greater probing depth and resolving power

    _____sounding curve is generally discontinuous

  20. Bonus Question: What is the difference in gravity between a gravity reading taken on the ocean floor (500 m below sea level) and one taken at sea level due to the mass of the sea water only. Assume r = 1.0 Mg/m3. Think about this one! (3 pts)