
As you perhaps have noticed that colors used on these pages are different from those on your system. This is because you can change the colors of many displayable items.
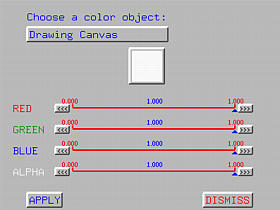
To change colors, select Window, followed by Change Color Scheme. This will bring up the Color Scheme Window as shown below.
In this window, you will see four sliders: RED, GREEN, BLUE and ALPHA. The first three sliders are for changing the intensity level of the three color components (i.e., read, green and blue). The fourth slider controls the level of transparency of a color (i.e., the alpha channel). More precisely, alpha channel value 0 (resp., 1) produces a completely transparent (resp., non-transparent) color. An alpha channel value closer to 0 produces a color more transparent than an alpha value closer to 1.
The button below Choose a color object will cause a pull-down menu to appear, which contains all objects whose colors can be altered. These objects include the drawing canvas, the current curve, control point, control point index, the selected control point, the tracing point, knot points and so on. You can also change the color used for displaying the de Casteljau or the de Boor net. There are only ten levels of colors, named as De Casteljau 1 to De Casteljau 10.
To change the color of any one of these objects, select that object from the pull-down menu, followed by changing each of the color components and their alpha channel value using the four sliders. The color corresponding to the current setting will be shown in the small square. If you are satisfied with a particular color, clicking on APPLY will apply the selected color to that object on the drawing canvas. Please note that the color you see on the drawing canvas may be slightly different from the color shown in the color square since objects on the canvas are illuminated with light sources.
This process can be repeated as many times as you want until you are satisfied. Note that the convex hull should have a transparent color so that the control polygon, control points and other objects can be seen through the convex hull. Otherwise, a non-transparent convex hull will block almost all the details of a curve.

There is a second way to keep track the color scheme being used. Start the curve system and save the color scheme before making any color changes. This will create a file curve.rc. Then, you can rename this file as curve.rc.default. When it is necessary to go back to default colors, just rename it to curve.rc.
Although you can change the color of the current curve, since you can make any curve the current one, the color for the current curve is not well-defined. As a result, saving the color scheme does not guarantee the color for the curve will change next time when the system runs. More precisely, if you set the current curve to use color red and save the color scheme, then when you run the curve system again the curve may not be shown in red.
An improvement will be made in a future version.