Frequently Asked Questions
Project Tips:
        1. In the Excel spreadsheet, is there a better way to paste formula to large blocks of cells?
          (click here for answer)

      Process Modeling Using Spreadsheets
         
        2. Why do you need to convert the raw data to deviation variables ?
          (click here for answer)
        3. What information does the RMS provide in the estimation procedure ?
          (click here for answer)
        4. How do we know the order of the process ?
          (click here for answer)
        5. How can we provide initial guesses of the model parameters ?
          (click here for answer)
           
      Frequency Response Plots
           
        6. Should the value of tshift be positive or negative ?
          (click here for answer)
        7. In Excel, how do we draw the Bode plots in logarithmic scale ?
          (click here for answer)
        8. How do we draw the Nyquist plots by using amplitude ratio and phase shift data ?
          (click here for answer)

    1. In the Excel spreadsheet, is there a better way to copy and paste large blocks of data?
Answer:

Yes.

Suppose you want to copy a horizontal block of data to several (say 2000?) rows down.

First, select the blocks you need to copy - mouse-dragging should not be too difficult for this step.
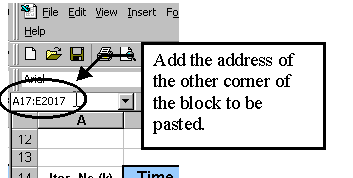
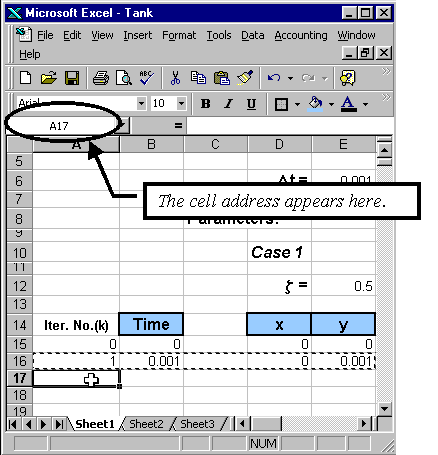
Next, click on a corner cell of the block to be copied to.  The address of this cell should appear in the northwest corner of the spreadsheet (see Figure 1):

 
Next, edit the value in that edit box to include the range.
After hitting enter, the large block of cells should be marked. Now, select [PASTE] from the [Edit] menu and the formulas should be pasted to all chosen cells.
2. Why do you need to convert raw input/output data to deviation variables ? Answer:

Because the model will be in terms of deviation variables.  In addition, we get the convenience of using zero initial conditions for z1, z2, ... , zN.  (For the specific case of project 2, if the raw data is already having initial conditions of zero for u and y, then there is no need for converting to deviation variables.)
 

    3. What information does the RMS provide in the estimation procedure ?
Answer: The root mean square (RMS) is an indicator of how good your model is predicting the behavior of the process.  The smaller this value is, the better your model is. The RMS takes the square root of the average of squared errors of each predicted points.  The rationale for considering the square of the errors is partly to focus on the magnitude of error (as opposed to differentiating between positive or negative errors).
    4. How do we know the order of the process ?
       
          Answer:
          There is not one answer to this question.  Generally, it depends on the requirements of the model.  If the purpose is to just characterize the time constant, a smaller order is favored.  However, if the model is to be used for control studies, the model should contain a sufficiently high order to cover the limiting effects of the the additional order.
    5. How do we choose initial guesses of the model parameters ?
Answer: When using Excel SOLVER, the optimization is considerably fast that most guesses (that are not violating the stability constrainsts) would work.  However, if SOLVER diverges then effort should be put in improving the initial guess.  If the process is first order or second order, one could usually approximate the parameters by using the time constants and/or damping coefficients.  Other methods would be to use frequency response methods (to be discussed later in the course) to help determine the order and some of the parameters.
    6. Should the value of tshift be positive or negative ?
       
          Answer:
          When measuring the time shift of output from the input of an actual system, the output should always lag the input signals because of causality (the input is the cause and the output is effect/response).  So, one should have a negative value for tshift.  Likewise, since the phase shift is given by f=w tshift, it should also be expected to be negative.
    7. In Excel, how do we draw the Bode plots in logarithmic scale ?
       
          Answer:
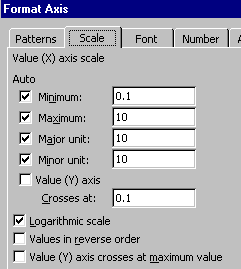
          Right click on the x-axis to select the "Format Axis…" menu item. A properties window should appear.


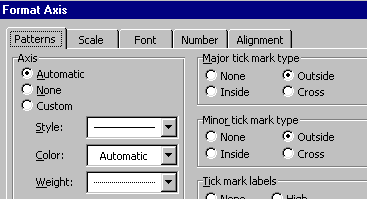
          Select the "SCALE" tab and check the "Logarithmic scale" option. It is also advisable to next click on the "PATTERNS" tab and under the "Minor tick mark type" select the "Outside" option.


    8. How do we draw the Nyquist plots by using amplitude ratio and phase shift data ?
        Answer:
        From the amplitude ratio, AR, and the phase shift, f, obtain the x-y position by using the trigonometric formula, Re(G)=AR cos(f) for the x-axis and Im(G)=AR sin(f) for the y-axis. Note however, that when using Excel, the arguments used by cosine and sine function should be in radians.