Tutorial
on Using Excel Spreadsheet to Obtain Bode Plots and Nyquist Plots
-
Preliminaries:
-
Given: G(s), a transfer function in Laplace domain
-
Required: Frequency response plots corresponding to G(s)
-
Bode Plots.
-
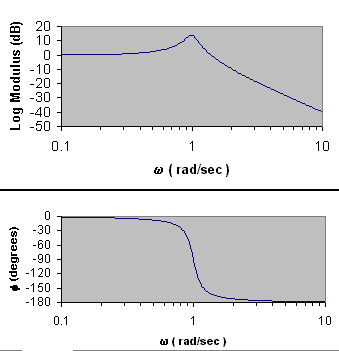
These consist of two plots. The first plot is a plot of log modulus (in
decibels) versus frequency. The second plot is the phase shift (in degrees)
versus frequency. Both plots usually have the frequency in logarithmic
scale.
-
Using the given transfer function G(s),

-
Nyquist Plots.
-
The Nyquist plots is obtained by simply plotting Imaginary(G(iw))
versus Real(G(iw))
-
Spreadsheet Implementation:
For discussion purposes, consider a second order transfer
function,

-
Set up some cells for the various parameters in the transfer function.
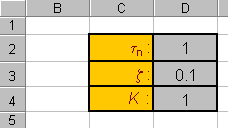
-
Next, determine the range of frequencies that are of interest. For example,
let 10-1 < w < 101.
Since the frequency will be plotted in logarithmic scale, you can use a
column to include numbers ranging linearly from -1 to 1, e.g. -1, -0.99,…,
0.98, 0.99, 1. Then use another column to evaluate the frequency, e.g.
w
= 10-1, 10-0.99, …, 100.98 100.99,
101.
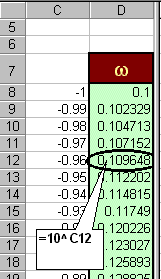
-
In the next column, build cells containing complex numbers, s=iw.
This can be done by using the
COMPLEX( , ) function provided in Excel.
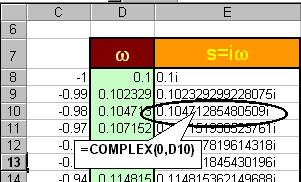
(Note: you may need to change the width of the column in
order to see the numbers)
-
Now evaluate the transfer function, G(s), with s=iw, using the built-in
functions, IMDIV(a,b), IMSUM(a,b), IMPRODUCT(a,b), IMPOWER(a,n) to perform
complex division, sum, product and power operations on complex numbers
a and b, with n as integer.
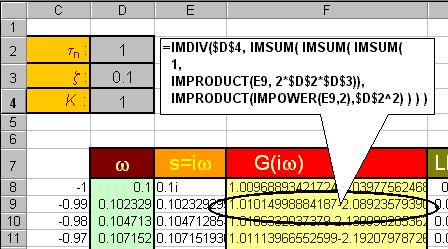
-
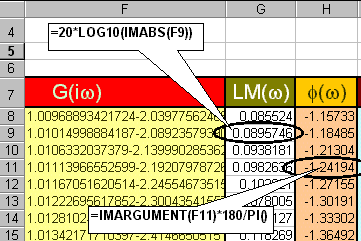
From the results in G(iw), obtain the Log Modulus
and Phase Shift columns:
-
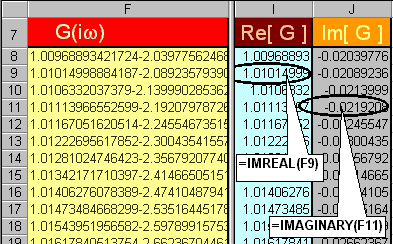
Also, from G(iw), obtain columns that evaluate
Re[G] and Im[G], respectively:
-
Using the Log modulus, Phase Shift and Frequency columns, obtains the Bode
plots:
-
Using the columns for Re[G] and Im[G], obtain the Nyquist Plot:

This page is maintained by Tomas B. Co (tbco@mtu.edu).
Last revised 2/1/00.
Tomas B. Co
Associate Professor
Department of Chemical Engineering
Michigan Technological University
1400 Townsend Avenue
Houghton, MI 49931-1295
Back to Homepage


![]()


