Short Tutorial on Simnon
for Windows
I. Scenario
Suppose you want to investigate how the dynamics of the liquid level
of a cylindrical tank is affected:
a) by using different diameters of the tank - design parameters
b) by changing the valve opening - manipulated variable
c) by changes in inlet flow rate - disturbance effects
II. Process Model
Let
h = height of liquid in tank
u = fraction of opening in valve
d = diameter of tank
Fin = inlet volumetric flow rate
Kv = valve coefficient
Then the process model is given by
dh/dt = ( Fin - Fout )/A
where
Fout = u Kv h1/2
A = p d 2/4
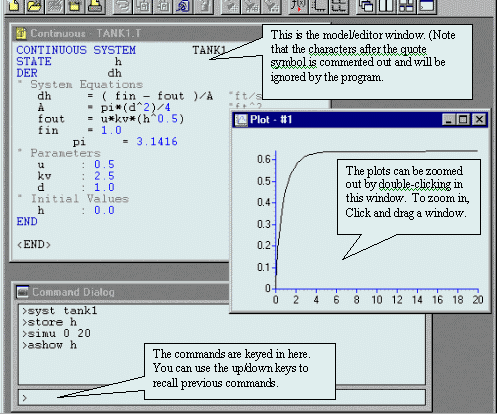
III. Build a SIMNON model
Use NOTEPAD (or other text editors) to create a file named TANK.T (in
your own subdirectory) and input the following text:
CONTINUOUS SYSTEM TANK
STATE h
DER dh
" System Equations
dh = ( fin - fout ) / A "ft/sec
A = pi*(d^2)/4 "ft^2
fout = u*kv*(h^0.5) "ft^3/sec
fin = 1.0 "ft^3/sec
pi = 3.1416
" Parameters
u : 0.5
kv : 2.5 " (ft^3/sec)
d : 1.0 " ft
" Initial Values
h : 0.0 " ft
END
Remarks:
-
The model file name needs an extension .T ( for text ). ( Since Notepad
in Windows 95 is likely to append the file name automatically by the extension
.txt, you need to override this by enclosing the filename you are saving
by double quotes, e.g. "tank.t")
-
The structure of the file includes the heading: CONTINUOUS
SYSTEM TANK in which TANK is the name of the model file but without
the .T extension. This heading has to be the first line of the file.
-
After the heading, the declaration statements: STATE
h and DER dh, declares the variable
h
as the variable which is going to change with time, while the other statement
declares dh as the time derivative variable of h.
-
Comment lines included in the file are marked by the double quotation mark.(It
is good practice to include some useful description, such as dimensions,
after the statements.)
-
The equal sign signifies that the line is treated as an equation, while
the colon signifies that that particular variable will be treated as constant
which can be changed during run time as will be shown later.
-
The last line of the model file has to be the END
statement
-
One feature of simulators like SIMNON is that except for the heading, declaration
and END statements, the lines in between do
not have to be in any particular order.
-
SIMNON does not distinguish between capitalized and small letters, thus
temp
and TEMP will be treated as the same variable.
-
As an alternative to using NOTEPAD, you can use the editor that comes with
SIMNON. First, run SIMNON and the choose File|New menu item, and input
the file name (no extension). When the editor appears, comment out the
lines which contain INPUT, OUTPUT and TIME by preceding these lines by
a double quote character. After the file has been edited, select File|Save
and the file will be saved with the extension .T automatically applied.
IV. Running a Simulation Session

-
Click on the SIMNON icon on the desktop or select from Start|Programs|Simnon
menu to enter the program.
-
Click once more on the grey box and a command window should appear. (Should
the command window disappear, just select Window|Command Dialog
from the menu. )
-
Select File|Open menu item and open the file just created.
-
In the command window, compile the model file by typing:
SYST TANK
(without the extension .T). If an error appears, go to the model/editor
window and correct the syntax error and compile again until no error message
appears.
-
Declare the variables you wish to store during simulation by typing:
STORE h
-
Begin the simulation by typing:
SIMU 0 20
which states that you are going to simulate from time=0 to time=20.
-
Plot the results, type:
ASHOW h
-
Print the plot by selecting File|Print in the menu bar (or press the corresponding
icon). Make sure the plot window is active.
-
To print to a file, you can use the HCOPY command, for example
HCOPY EPS TANK
will produce a file TANK.EPS which can then be imported to other word processors.
V. Enhancing the plot
-
You can zoom out by double-clicking the left button while the cursor is
in the plot window. You can zoom in by dragging a window inside the plot.
(Caution: after zooming in, the plots are clipped depending on the window
size.)
-
You could also specify the range of the horizontal axis
AXES H 0 5
or the range of the vertical axis
AXES V 0 0.7
-
To read the graph you could type the command
GIN
which means "graph input" and the position of the cursor based on the graph
will be shown in the window title bar. Click the left mouse button to end
this command.
-
You can put a label for the y-axis at the top of your plot using the TEXT
command,
TEXT 'h ( ft )'
-
You can also put text inside the plots by a sequence of commands
GIN
MARK A XS. YS.
MARK "This is a sample text
where the text after the comment will be put in the position where the
cursor was positioned last during the GIN command. Note that the periods
after XS and YS are necessary. Also, the cursor is only allowed inside
the plot ranges.
VI. Varying the Parameters and Initial Conditions.
-
Go back to the original plot by typing: ASHOW h
-
To obtain the current value of diameter d, type
DISP d
( To display the current values of all variables and parameters, just type
DISP by itself )
-
The value should show up in the bigger box in the command window. ( Currently,
it should be d=1.0)
-
Now change the value of d using the PAR command then simulate again
PAR d:1.5
SIMU 0 20
(Note the use of colon instead of equal sign.)
-
Instead of using ASHOW, this time use SHOW
SHOW h
(The command ASHOW will always erase the previous plot before generating
a new one. The command SHOW will plot on top of the previous plot.) It
is a good practice to label each curve with the corresponding case using
the GIN and MARK command sequence described above.
Exercise: How much time is needed for the level to rise to 0.5
ft when the diameter, d=1.0, d=1.5 and d=2.0 ? Does the diameter affect
the steady state height ?
Exercise: How much time is needed for the level to rise to 0.5
ft with d=1.0, but now using u=0.25, u=0.5 and u=0.75 ? How is the steady
state height affected ?
-
You could also change the initial condition of h by using INIT instead
of PAR:
INIT h: 0.2
VII. Modify the Model to Simulate Disturbance Effects:
Suppose the flow changes as follows: at time=2, the flow changes from
a constant rate of 1 cu ft/sec to a sinusoidal flow described by: fin (t>2)
= 0.2sin(2t)+0.6. The model needs to be modified as follows:
An additional declaration of the time variable is required: TIME t
The variable fin needs to be replaced by the following statements:
fin=if t<2 then fin1 else fin2
fin1=1.0
fin2=0.2*sin(2*t)+0.6
The resulting model is thus
CONTINUOUS SYSTEM TANK
STATE h
DER dh
TIME t
" System Equations
dh = ( fin - fout ) / A "ft/sec
A = pi*(d^2)/4 "ft^2
fout = u*kv*(h^0.5) "ft^3/sec
fin = if t<2 then fin1 else fin2
fin1 = 1.0
fin2 = 0.2*sin(2*t)+0.6
pi = 3.1416
" Parameters
u : 0.5
kv : 2.5 " (ft^3/sec)
d : 1.0 " ft
" Initial Values
h : 0.0 " ft
END
Exercise: Simulate the response of the tank level when d=1.0,
d=2.0 and d=3.0 ? Which dampens the oscillation better ?
(Note: when you type SYST to compile again, the STORE list is emptied.
Thus, you need to use the STORE statement each time SYST is used. To see
the list of variables in the store list, type : STORE ?. )
VII. Exit the program
Either select the File|Exit menu item or type STOP at the command
dialog window.
This page is maintained by Tomas B. Co (tbco@mtu.edu). Last
revised 12/1/1998.
Tomas B. Co
Associate Professor
Department of Chemical Engineering
Michigan Technological University
1400 Townsend Avenue
Houghton, MI 49931-1295
Back to Homepage