WARNING: This example assumes the output is sent to a printer, and as a result, every formatted output contains printer control.
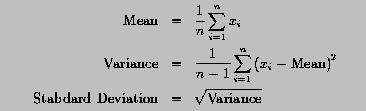
Write a program to read in a set of real values and use the above formulas to compute the mean, variance and standard deviation. Moreover, this program should generate a table containing the following addition information:
         1    1    2    2    3    3    4
....5....0....5....0....5....0....5....0
 Input Data:

  No  Data
 === ======
   1   6.60
   2   6.00
   3   4.00
     :
     :
     :
  10   5.20

 Mean               :       6.7100000
 Variance           :       3.3498888
 Standard Deviation :       1.8302702

 Analysis Table:

  No  Data    Dev
 === ======  =====
   1   6.60  -0.11
   2   6.00  -0.71
   3   4.00  -2.71 <-- Bad
   4   9.00   2.29 <-- Good
   5   4.50  -2.21 <-- Bad
   6   7.30   0.59
   7   9.50   2.79 <-- Good
   8   8.00   1.29
   9   7.00   0.29
  10   5.20  -1.51
This problem was discussed in one-dimensional array processing. Click here to review the previous version for comparison.
![]()
! --------------------------------------------------------------------
! PROGRAM  MeanVariance:
!    This program reads in an array and computes the mean, variance
! and standard deviation of the data stored in the array.  Then, it
! displays an analysis table.  If a value is greater than the value
! of (mean + standard deviation), it displays a "good".  If a value
! is less than the value of (mean - standard deviation), it displays
! a "bad".
! --------------------------------------------------------------------

PROGRAM  MeanVariance
   IMPLICIT  NONE

   INTEGER, PARAMETER :: MAX_SIZE = 50       ! maximum array size
   REAL, DIMENSION(1:MAX_SIZE) :: Data       ! input array
   REAL               :: Mean, Variance, StdDev   ! results
   INTEGER            :: n                   ! actual array size
   INTEGER            :: i                   ! running index
   CHARACTER(LEN=20)  :: For_Title    = '(A, A)'
   CHARACTER(LEN=20)  :: For_Data     = '(I4, F7.2)'
   CHARACTER(LEN=20)  :: For_Result   = '(A, A, F15.7)'
   CHARACTER(LEN=20)  :: For_Analysis = '(I4, 2F7.2, A)'

   READ(*,*)  n                              ! read in input array
   READ(*,*)  (Data(i), i = 1, n)
   WRITE(*,For_Title)  " ", " Input Data:"   ! display the input
   WRITE(*,*)
   WRITE(*,For_Title)  " ", "  No  Data"
   WRITE(*,For_Title)  " ", "=== ======"
   WRITE(*,For_Data)   (i, Data(i), i = 1, n)

   Mean = 0.0                                ! compute mean
   DO i = 1, n
      Mean = Mean + Data(i)
   END DO
   Mean = Mean / n

   Variance = 0.0                            ! compute variance
   DO i = 1, n
      Variance = Variance + (Data(i) - Mean)**2
   END DO
   Variance = Variance / (n - 1)
   StdDev   = SQRT(Variance)                 ! compute standard deviation

   WRITE(*,*)                                ! display result
   WRITE(*,For_Result) " ", "Mean               : ", Mean
   WRITE(*,For_Result) " ", "Variance           : ", Variance
   WRITE(*,For_Result) " ", "Standard Deviation : ", StdDev
   WRITE(*,*)
   WRITE(*,For_Title)  " ", "Analysis Table:"! display an analysis table
   WRITE(*,*)
   WRITE(*,For_Title)  " ", " No  Data    Dev "
   WRITE(*,For_Title)  " ", "=== ======  ====="
   DO i = 1, n
      IF (Data(i) > Mean + StdDev) THEN
         WRITE(*,For_Analysis)  i, Data(i), Data(i) - Mean, " <-- Good"
      ELSE IF (Data(i) < Mean - StdDev) THEN
         WRITE(*,For_Analysis)  i, Data(i), Data(i) - Mean, " <-- Bad"
      ELSE
         WRITE(*,For_Analysis)  i, Data(i), Data(i) - Mean
      END IF
   END DO

END PROGRAM  MeanVariance
Click here to download this program.
The output of the program is:10 6.6 6.0 4.0 9.0 4.5 7.3 9.5 8.0 7.0 5.2
         1    1    2    2    3    3    4
....5....0....5....0....5....0....5....0
 Input Data:

  No  Data
 === ======
   1   6.60
   2   6.00
   3   4.00
   4   9.00
   5   4.50
   6   7.30
   7   9.50
   8   8.00
   9   7.00
  10   5.20

 Mean               :       6.7100000
 Variance           :       3.3498888
 Standard Deviation :       1.8302702

 Analysis Table:

  No  Data    Dev
 === ======  =====
   1   6.60  -0.11
   2   6.00  -0.71
   3   4.00  -2.71 <-- Bad
   4   9.00   2.29 <-- Good
   5   4.50  -2.21 <-- Bad
   6   7.30   0.59
   7   9.50   2.79 <-- Good
   8   8.00   1.29
   9   7.00   0.29
  10   5.20  -1.51
         1    1    2    2    3    3    4
....5....0....5....0....5....0....5....0
  No  Data    Dev
 === ======  =====
   1   6.60  -0.11
   2   6.00  -0.71
   3   4.00  -2.71 <-- Bad
   4   9.00   2.29 <-- Good
   5   4.50  -2.21 <-- Bad
   6   7.30   0.59
   7   9.50   2.79 <-- Good
   8   8.00   1.29
   9   7.00   0.29
  10   5.20  -1.51
Each row contains four items, an INTEGER, two REALs
and possibly a CHARACTER string. The INTEGER uses
four positions, including the first position for printer
control. Each of the second and third values uses 7 positions with
the last two positions for the fractional part. Therefore,
they can be printed with 2F7.2. Finally, the
CHARACTER string is the simplest; we just use A.
Therefore, the format should be:
Now, the problem is that some lines do not have the CHARACTER string. Would that matter? No, recall the rescanning rule that if all variables are printed and there are unused edit descriptors, the unused ones are ignored. In this case, if the WRITE only prints the numbers without the string, the last A edit descriptor is ignored.CHARACTER(LEN=20) :: For_Analysis = '(I4, 2F7.2, A)'