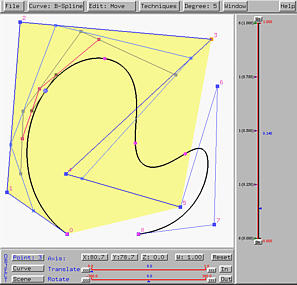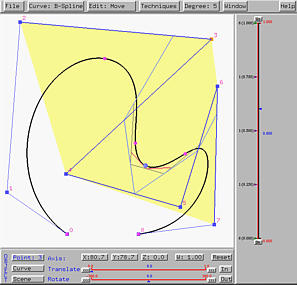

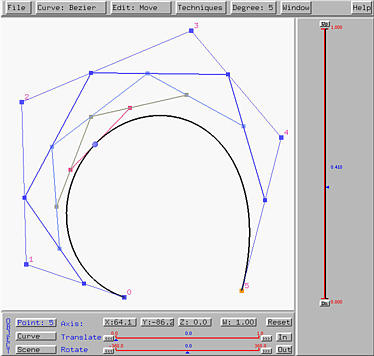
Tracing a curve is a simple task. Dragging the small triangle (i.e., the u-indicator) in the right-hand side of the vertical slider moves its corresponding point on the curve. This point is referred to as the tracing point.

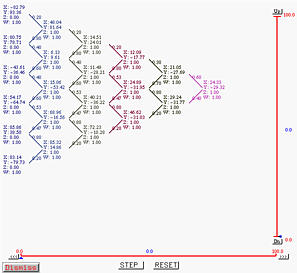
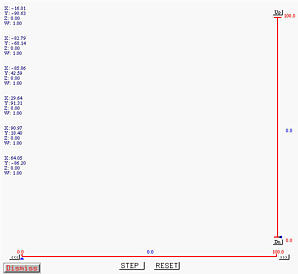
The above only displays the de Casteljau net graphically. This system can also show the detailed computations step-by-step. To see this, select Window followed by Triangular Computing Scheme. This will bring up the Triangular Computing Scheme Window. This window has a button STEP for displaying the computation of de Casteljau's algorithm step-by-step. Clicking on STEP displays the left-most column which contains all given control points as show below:
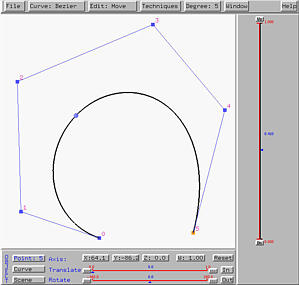
Clicking on STEP again displays the second column, each element of which is computed as the combination of the north-west and south-west control points on the first column. The south-east pointing and north-east pointing arrows have values 1-u and u, respectively. Note that the points on each column correspond to a polyline of the de Casteljau net. Since we have two columns, we have two polylines of the de Casteljau net.
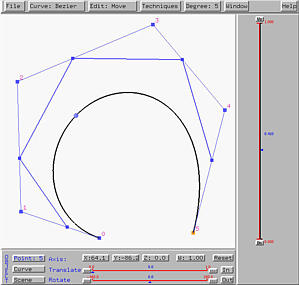
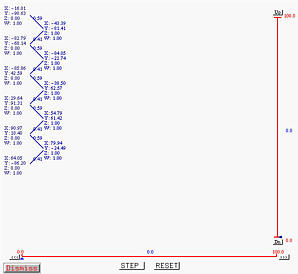
Clicking on STEP twice produces the following result. As you can see, we have four columns and hence four polylines of the de Casteljau net.
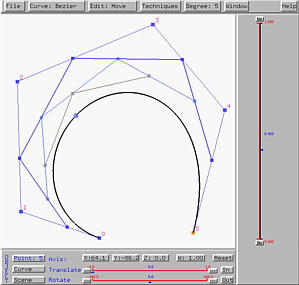
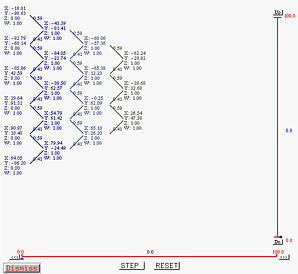
Clicking on STEP twice again will produce a single point, which is the point on the curve corresponding to the given u.
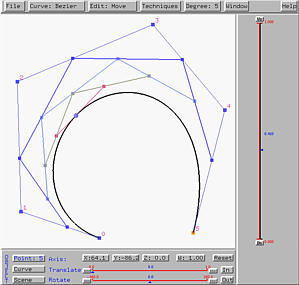
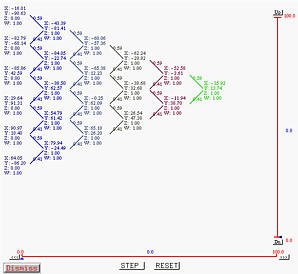
Button RESET resets the computation so that we can restart the computation.
The vertical and horizontal sliders in the Triangular Computing Scheme Window are used for scrolling the triangular-shaped computation vertically and horizontally, respectively.

Another major difference between de Casteljau's and de Boor's algorithm is that the weights for computing intermediate control points of the de Boor net are not 1-u and u. In the case of de Boor's algorithm, these weights must be computed separately as they are different in each stage. As a result, the new points do not subdivide the line segments in a ratio of u/(1-u).
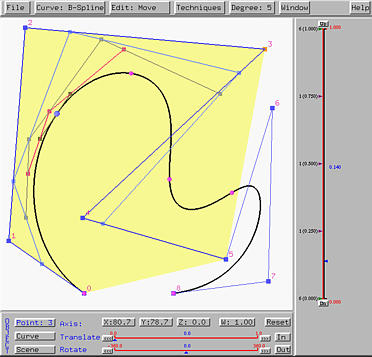
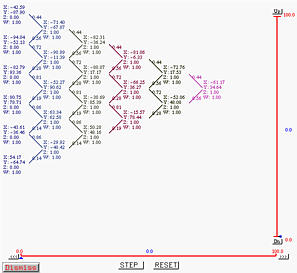
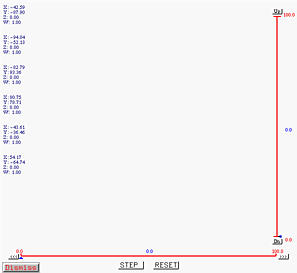
Selecting Window followed by Triangular Computing Scheme brings up the Triangular Computing Scheme Window. This window works for both de Casteljau's and de Boor's algorithms. However, when the curve is a B-spline or NURBS, only those involving control points will be shown. Clicking on STEP will display the first column which is actually part of the control polygon.
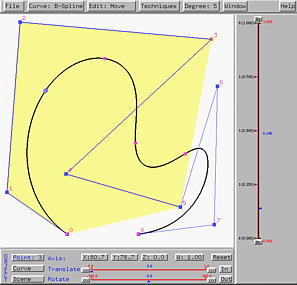
Clicking on STEP once computes the second column:
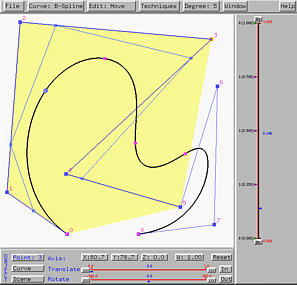
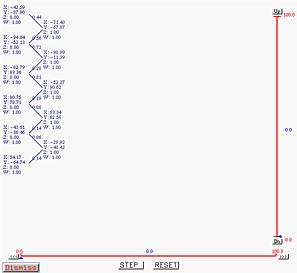
Clicking on STEP two more times finishes columns 3 and 4.
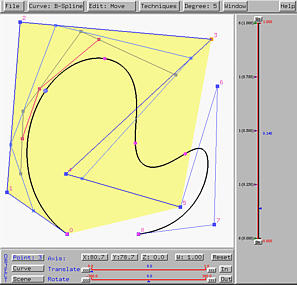
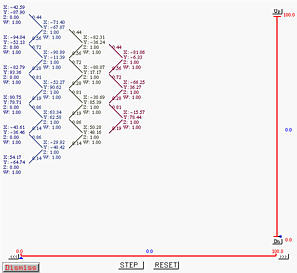
Clicking on STEP twice again reduces the number of points to one and this is the point corresponding to u=0.14 on the B-spline curve.
