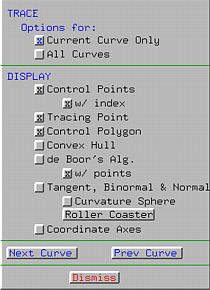
The Display & Tracing Options Window

The Display & Tracing Options Window provides a way to set
various display and tracing options. As shown below, the window is divided
into four parts. The first part is to indicate if the options should affect
all curves or the current curve. The second part contains 11 display options.
The third part provides a short cut for selecting the next curve or the
previous curve to be the current curve. Finally, the four part is for
closing this window. Clicking on these buttons activate or deactivate the
select options. Options selected will be marked with a
X. Some buttons are indented.
This means those options are activated only if their "parent" options have
been activated.

If you want the selected options applied to all curves on the
drawing canvas, click on All Curves.
Otherwise, the options will be applied to the current curve.
The display options include the following:
- Control Points
If this option is activated, control points will be displayed.
If w/ index is also activated,
the control point indices (or IDs) will be shown.
- Tracing Point
If this button is activated, the tracing point will
be displayed. As the little triangle (i.e., the
u-indicator) in the right-hand side of the vertical slider
moves, its corresponding point, the tracing point, on the curve
moves accordingly.
- Control Polygon
If this button is activated, the control polygon will be shown.
- Convex Hull
If this button is activated, the convex hull of the current
u will be shown.
- de Casteljau's Alg./de Boor's Alg.
When the current curve is a Bézier curve, this button
shows de Casteljau's Alg.;
otherwise, it shows
de Boor's Alg..
If this button is activated, the de Casteljau or de Boor net
will be shown. If w/ points
is also activated, the endpoints of each segment will also be
shown. See Tracing the Curve - de
Casteljau's and de Boor's Algorithm for further details.
- Tangent, Binormal & Normal
If this button is activated, the tangent vector, binormal vector
and the normal vector at the tracing point (i.e., the
moving triad) will be shown. If button
Curvature Sphere is also
activated, the curvature sphere at the tracing point will also be
shown. Moreover, if
Roller Coaster is activated,
the Roller Coaster Window appears showing the
roller coaster effect. Note that the curvature sphere and the
roller coaster effect are independent of each other.
See The Moving Triad,
The Curvature Sphere, and
The Roller Coaster Effect for
further details about the moving triad, curvature sphere and roller
coaster effect, respectively.
- Coordinate Axes
If this button is activated, the coordinate axes will be shown in
the drawing canvas.
Clicking Next Curve and
Pre Curve selects the next curve and
previous curve to be the current curve. If the current curve is the
last (resp., first) curve, the next (resp., previous) curve
is the first (resp., last) curve.
Finally, clicking on Dismiss closes
this window.


